What This Quarter's Jobs Report Means for Wage Growth
ALT: Jobs report data chart showing wage growth trends and labor market signals for economic analysis
For educational purposes only. Not investment advice.
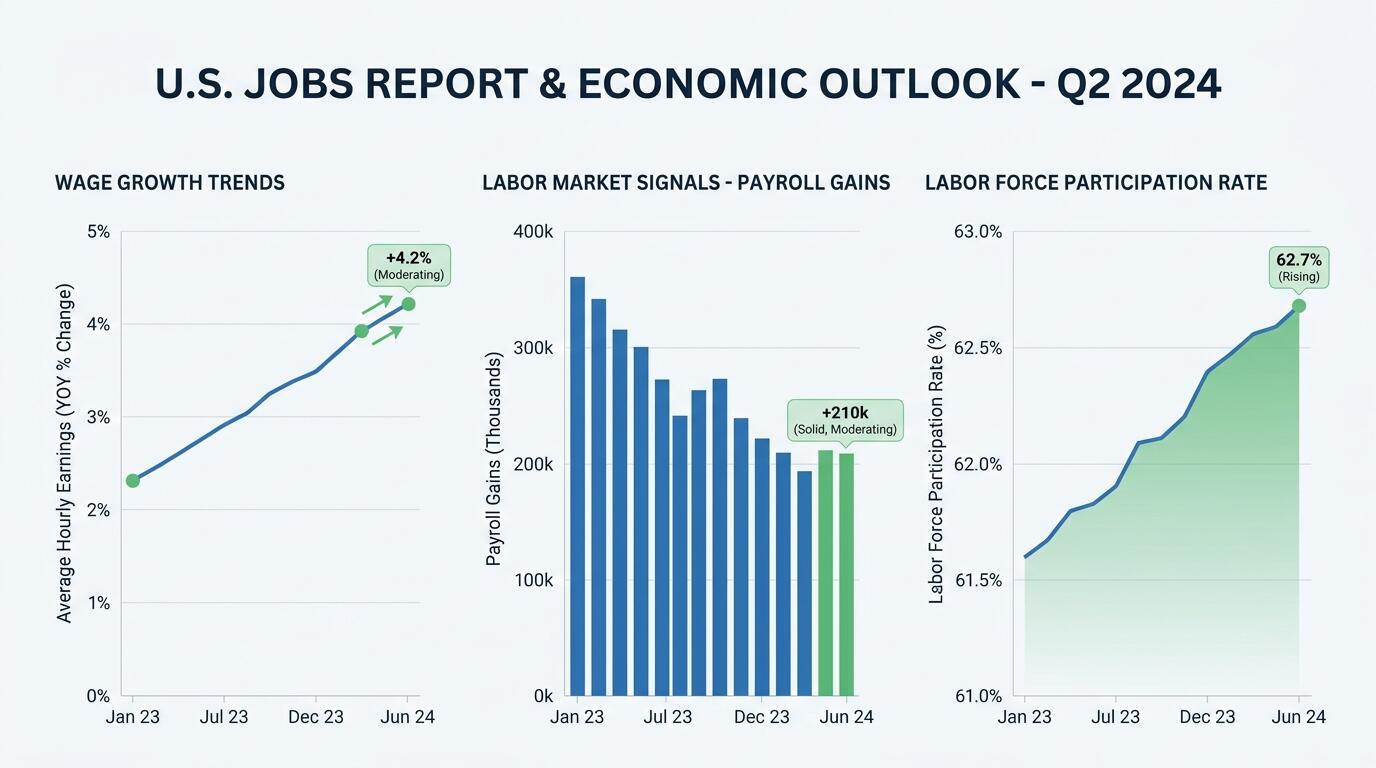
ALT: Jobs report data chart showing wage growth trends and labor market signals for economic analysis
Jobs Report vs. Wage Reality: What the Latest Employment Numbers Tell Us About Worker Pay
The central question most news-aware adults have after a jobs report drops is deceptively simple: are workers actually making more money, and does that help or hurt the broader economy? The direct answer is that job creation numbers alone rarely tell the full story — wage growth data, embedded deeper in the same report, is where the real economic signal lives. This quarter's employment report offers a telling contrast between headline job gains and the more nuanced reality of what those gains mean for paychecks, purchasing power, and the financial decisions millions of Americans face every day.
This article compares three dimensions of the jobs report that matter most for understanding wage growth: total payroll gains, average hourly earnings, and labor force participation. Each dimension tells a different part of the story, and understanding how they interact is what separates informed financial news readers from those who react to the headline and move on.
The Criteria That Actually Matter When Reading a Jobs Report for Wage Insights
A jobs report is not a single number — it is a layered dataset published monthly by the U.S. Bureau of Labor Statistics (BLS), and each layer answers a different question about the health of the labor market and its relationship to wages.
The three criteria that consistently prove most useful for understanding what a jobs report means for wage growth are:
Payroll gains in context. The headline number — total nonfarm payrolls added during the month — tells you whether employers are hiring, but it doesn't tell you what they're paying. A quarter with strong job creation in low-wage sectors like food service and retail will look very different from one dominated by gains in professional services or technology, even if the headline numbers are similar. The composition of job growth matters enormously for understanding where wages are headed.
Average hourly earnings growth. This is the wage signal most economists watch most closely. The BLS reports average hourly earnings as both a month-over-month and year-over-year figure. Year-over-year comparisons are particularly useful because they smooth out seasonal noise. When average hourly earnings grow faster than inflation, workers have real purchasing power gains. When they lag inflation, even a pay raise can feel like a cut.
Labor force participation rate. This criterion is subtler but critical. The participation rate measures the share of working-age adults who are either employed or actively looking for work. When more people enter the labor force, competition for jobs increases — which can moderate wage growth even in a tight market. Conversely, a shrinking participation rate can keep wages elevated because employers have fewer candidates to choose from.
Unemployment rate as a backdrop. A low unemployment rate generally signals that employers must compete harder for workers, which pushes wages up. But this relationship is not mechanical. The type of unemployment matters: structural unemployment (workers whose skills don't match available jobs) responds differently to wage pressures than cyclical unemployment (workers temporarily displaced by economic slowdowns).
Sector-level wage divergence. Aggregate wage figures can mask significant inequality across industries. In our work covering financial news for everyday readers, a pattern we consistently see is that people are surprised to learn how much average hourly earnings can vary — sometimes by a factor of two or more — between the fastest and slowest-paying sectors tracked in the same report.
Understanding these five criteria together gives you a genuine framework for reading any jobs report, not just this quarter's.
Headline Payroll Gains — The Number Everyone Reports
Headline payroll growth is a measure of net new jobs added to the U.S. economy in a given month, as estimated by the Bureau of Labor Statistics through its Current Employment Statistics survey. This quarter, private-sector job creation continued — driven in part by gains across several service industries — though the pace and composition have shifted compared to the post-pandemic surge years.
According to reporting from NBC News on the August jobs report, the U.S. added approximately 162,000 jobs in that month, with wage growth lagging behind the levels many workers and economists had hoped to see. That single data point captures the tension at the heart of current labor market dynamics: jobs are being created, but the gains are not evenly distributed, and pay growth has not kept pace with earlier expectations.
What makes headline payroll numbers useful for wage analysis is that they establish whether the labor market is expanding or contracting. An expanding market, in theory, gives workers more leverage to negotiate better pay. A decelerating market — even one that is still positive — tends to shift bargaining power back toward employers.
Average Hourly Earnings — The Wage Signal That Matters Most
Average hourly earnings is the metric the Federal Reserve watches most closely when assessing whether wage growth could become inflationary. Strong wage growth is good for workers in isolation, but if it significantly outpaces productivity growth, it can become a cost-push inflation driver — which is precisely why the Fed has kept a close eye on this figure throughout its recent rate cycle.
The White House's own analysis of recent jobs data highlighted private-sector gains and wage growth, particularly for American-born workers — a framing that reflects how politically and economically layered wage data has become. Different groups of workers experience wage dynamics very differently, and aggregate figures can obscure important variation.
In our experience translating complex financial reports for general audiences, the average hourly earnings figure is the one that most directly answers the question everyday readers care about: "Are people taking home more money?" The answer this quarter is qualified: yes, nominally — but adjusted for inflation and broken down by sector, the picture is more uneven than the headline suggests.
Labor Force Participation — The Hidden Driver of Wage Pressure
Labor force participation rate is the percentage of the civilian non-institutional population aged 16 and older that is either employed or actively seeking employment, as measured by the BLS through the Current Population Survey. This figure shapes wage growth in ways that many news consumers don't fully appreciate.
When participation is low or declining, the pool of available workers shrinks — and shrinking supply, with demand for labor remaining stable, pushes wages higher. This is one reason wages rose so sharply in the immediate post-pandemic period. As participation has gradually recovered, some of that wage pressure has eased, which helps explain why wage growth, while still positive, has moderated relative to its peak.
Understanding the interplay between participation and wages is also relevant to how the Federal Reserve interprets jobs reports. A rate decision is not made on payroll gains alone — it reflects a careful reading of all labor market signals, including whether wage growth is consistent with the Fed's inflation target. For a deeper look at how those rate decisions ripple into mortgages and savings accounts, the explainer on how the Federal Reserve's current rate decisions affect your mortgage and savings is worth reading alongside this analysis.
Head-to-Head Comparison: What Each Signal Says About Wages Right Now
Criterion — Headline Payroll Gains — Average Hourly Earnings — Labor Force Participation
Direct wage signal — Indirect — volume, not price — Direct — measures pay explicitly — Indirect — affects wage pressure
Inflation sensitivity — Low — High — Moderate
Fed policy relevance — Moderate — Very High — High
Useful for workers — Context only — Most immediately relevant — Background structural signal
Sector granularity available — Yes — by industry — Yes — by industry — Limited — primarily aggregate
Lag in reflecting change — 1 month — 1 month — 1 month
Reading these three signals together paints a more accurate picture than any single metric can. This quarter, the combination of moderate payroll gains, softening average hourly earnings growth, and a gradually recovering participation rate suggests a labor market that is cooling — not collapsing, but transitioning from the tightest conditions of recent years toward something more balanced.
The practical implication for workers is nuanced. A more balanced labor market is not necessarily bad news for wages in the long run. If wage growth moderates alongside inflation, real purchasing power can be preserved or even improved. The risk is if wage growth decelerates faster than inflation does — leaving workers nominally better off but actually worse off in terms of what their paycheck buys.
For investors and market watchers, the wage data this quarter feeds directly into expectations about Fed policy. Slower wage growth reduces inflationary pressure, which gives the Fed more room to consider rate adjustments. That dynamic connects labor market data to asset prices, borrowing costs, and the broader economic environment in ways that are increasingly important to understand — particularly as AI investment is reshaping global growth trajectories and adding new complexity to labor demand forecasts.
The sector-level divergence visible in this quarter's data deserves particular attention. High-wage industries in technology and professional services have shown different wage dynamics than lower-wage sectors in hospitality and retail. When aggregate averages blend these together, they can create a misleadingly smooth picture. Workers and observers focused on specific industries need to look at sector-specific earnings data rather than relying on the overall average.
Which Signal Should You Focus On? Scenario-Based Guidance for Different Readers
The right signal to emphasize depends on what you're trying to understand about the economy and your own financial situation.
If you are a worker evaluating your current pay relative to the market, average hourly earnings in your specific industry is the most relevant figure. Aggregate wage growth is a useful benchmark, but your sector's trend is what actually reflects your bargaining environment.
If you are following monetary policy and trying to understand when interest rates might shift, focus on average hourly earnings growth relative to the Fed's inflation target. Persistent wage growth above the Fed's comfort zone typically signals rates will remain elevated. Moderating wage growth opens the door to policy easing — which matters for borrowing costs across mortgages, car loans, and credit cards.
If you are a student or early-career professional trying to understand the job market you're entering, labor force participation trends and sector-level payroll gains are most relevant. They tell you which industries are expanding, which are contracting, and how competitive the hiring environment is likely to be.
If you are an investor trying to read macro trends, all three signals matter, but their interpretation should be set against broader context: the pace of inflation, Federal Reserve guidance, and global economic conditions. No single month's jobs report tells the whole story — the pattern across several quarters is far more informative than any single data point.
Pros of focusing on average hourly earnings:
Most directly answers the wage question
Reported consistently and comparably over time
Closely tied to Fed policy expectations
Available at the sector level for granular analysis
Cons of relying on it alone:
Averages are sensitive to composition shifts (more low-wage jobs added can drag down the average even if individual workers aren't earning less)
Doesn't capture benefits, hours worked, or non-wage compensation
Month-to-month figures can be noisy
The broader lesson, one that consistently emerges in our work helping people decode financial news, is that no single economic indicator tells the full story. The value of reading a jobs report well is in understanding how each piece relates to the others.
ALT: Comparison chart of wage growth indicators from quarterly jobs report including payroll gains, hourly earnings, and labor force participation data
Q1: How does the jobs report affect wage growth forecasts?
The monthly jobs report, published by the U.S. Bureau of Labor Statistics, includes average hourly earnings data that economists and the Federal Reserve use to forecast wage trends. When job creation is concentrated in high-wage industries, it pushes average earnings upward. When low-wage sector hiring dominates, aggregate wages can appear to stagnate even if individual workers aren't seeing cuts. Analysts track year-over-year earnings growth over several quarters to identify durable trends rather than reacting to any single month's data.
Q2: Is wage growth always good for the broader economy?
Wage growth is broadly positive for workers and consumer spending, but its economic impact depends on context. Wage growth that outpaces productivity can contribute to cost-push inflation, prompting the Federal Reserve to raise interest rates — which in turn increases borrowing costs for mortgages, business loans, and consumer credit. Wage growth that roughly tracks inflation preserves purchasing power without creating inflationary pressure. The relationship between wages, inflation, and interest rates is one of the most closely watched dynamics in macroeconomic policy.
Q3: How long does it take for jobs report data to reflect real changes in worker pay?
The BLS publishes jobs report data with approximately a one-month lag, reflecting payroll and earnings conditions from the prior month. Meaningful wage trends typically require three to six months of data to distinguish from statistical noise. Year-over-year comparisons are considered more reliable than month-over-month figures for identifying genuine shifts in wage growth direction. Significant structural changes — like a major industry expansion or contraction — can take several quarters to show up clearly in aggregate earnings data.
The Bottom Line
This quarter's jobs report delivers three core takeaways for anyone trying to understand what it means for worker pay. First, headline payroll numbers are a necessary but insufficient signal — the composition and quality of job creation matters as much as the volume. Second, average hourly earnings growth is the most direct measure of wage trends and the one that most directly connects to Fed policy and inflation expectations. Third, labor force participation is a structural backdrop that shapes wage pressure in ways that often go unreported but that experienced economists watch carefully.
The practical next step for anyone following this data is to move past the headline number and look at the sector-level breakdown of both job gains and wage growth. The divergence between high-wage and low-wage sectors is significant right now, and aggregate figures can obscure what is actually a highly uneven labor market.
For workers, investors, and policy watchers alike, the jobs report is most useful when read as a system of interconnected signals — not as a single number that tells you whether the economy is good or bad. Learning to read it that way takes practice, but it pays off in a clearer, more grounded understanding of where wages and the broader economy are headed.
Ready to stop guessing what financial headlines actually mean? Vega Brief translates the most complex economic and market news into plain-English explainers — source-linked, jargon-free, and built for readers who want real understanding without the noise.
Sources & Further Reading
The White House. "PROGRESS: Jobs Report Shows Private Sector Gains, Wage Growth for American-Born Workers."
https://www.whitehouse.gov/releases/2025/11/progress-jobs-report-shows-private-sector-gains-wage-growth-for-american-born-workers/
NBC News. "U.S. Added 162,000 Jobs in August, Wage Growth Lags."
https://www.nbcnews.com/business/economy/august-jobs-report-trump-inflation-rcna595974
YouTube / Economic Commentary. "What the Latest Jobs Report Really Says About the Economy."
https://www.youtube.com/watch?v=lWU1FMHjYFU
U.S. Bureau of Labor Statistics. Employment Situation Summary and Current Employment Statistics Program.
https://www.bls.gov/
Board of Governors of the Federal Reserve System. Monetary Policy Reports and Labor Market Analysis.
https://www.federalreserve.gov/
Note: Economic data and policy guidance are updated regularly. Always consult the latest official publications from the Bureau of Labor Statistics and the Federal Reserve for current figures.
For educational purposes only. Not investment advice. We do not recommend any stock, fund, broker or trading platform. Headlines are sourced from Google News · Business; every story links to the original publishers.