What Is the Consumer Price Index (CPI)? A Plain-English Guide
ALT: Plain-English guide to understanding the Consumer Price Index CPI and inflation data
For educational purposes only. Not investment advice.
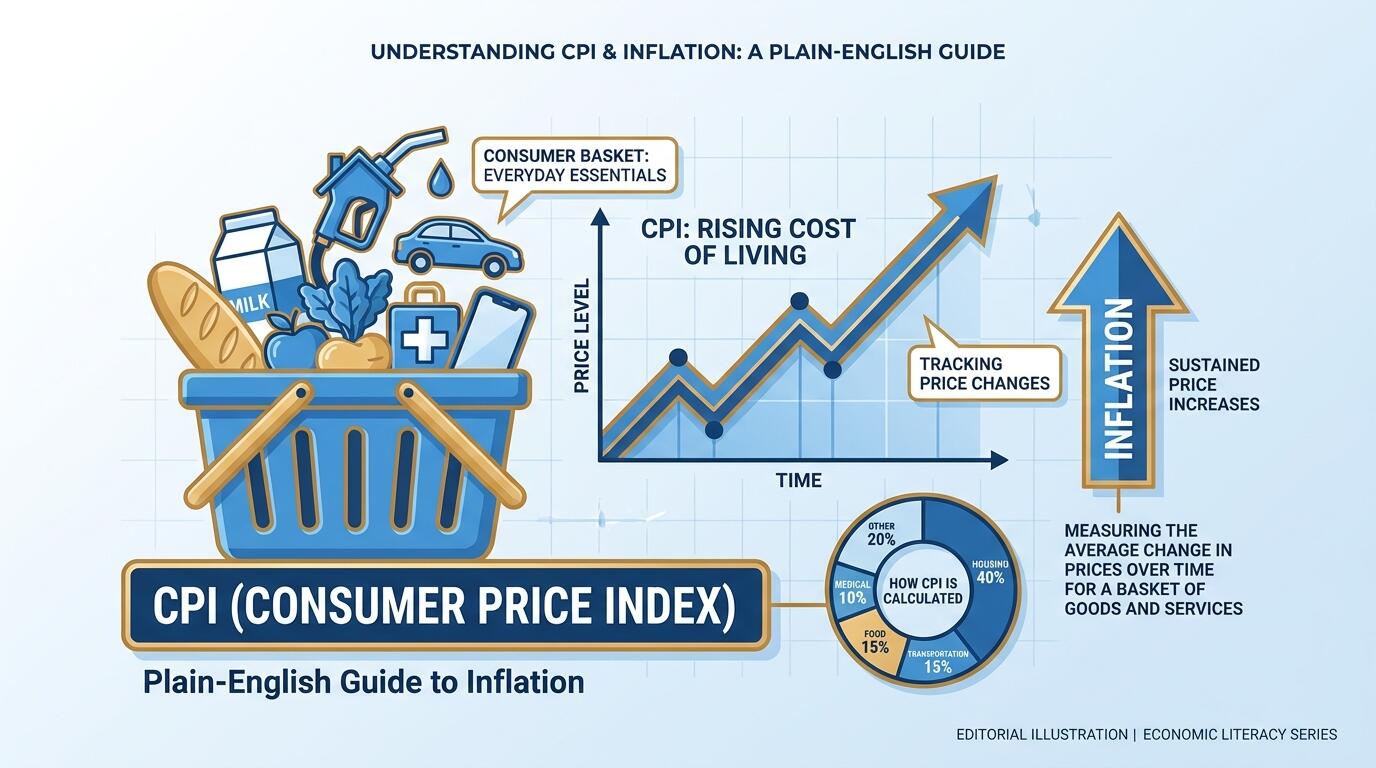
ALT: Plain-English guide to understanding the Consumer Price Index CPI and inflation data
What You'll Understand After Reading This CPI Guide
Key Conclusion: The Consumer Price Index (CPI) is the U.S. government's primary measure of inflation — tracking how much the price of everyday goods and services changes over time. By the end of this guide, you'll know exactly what CPI measures, how it's calculated, why it moves markets and policy decisions, and how to read CPI headlines with confidence — without needing an economics degree to do it.
Every month, a headline crosses the newsfeed: "CPI rises 0.3% in March" or "Inflation cools to lowest level in two years." Most people scroll past it, unsure whether it's good news, bad news, or even relevant to them personally. This guide is for anyone who wants to stop guessing and start understanding what the Consumer Price Index actually means — and why it matters more to your daily life than you might expect.
Before You Start: What You Should Know Going In
Reading this guide doesn't require a background in economics. But a few framing ideas will help you absorb the material faster and more clearly.
First, it helps to understand that inflation — the general rise in prices over time — is not a single number that gets discovered. It's calculated. A specific methodology, carried out by a government agency, produces the CPI figure you see in the news. Knowing that the number is constructed (rather than simply observed) changes how you interpret it.
Second, CPI is not the only inflation measure. Other measures exist — the Personal Consumption Expenditures (PCE) index, the Producer Price Index (PPI), and others — each with a slightly different scope and methodology. This guide focuses on CPI because it is the most widely cited, the most publicly visible, and the one most directly tied to policy decisions that affect everyday people.
Third, CPI headlines often come in two flavors: headline CPI and core CPI. You'll encounter both. Understanding the difference between them is one of the more practically useful things this guide covers.
Here's what to have in mind before diving in:
A general sense that prices rise over time (lived experience works fine here)
Awareness that the Federal Reserve and government policymakers respond to inflation data
Willingness to set aside the idea that economics is inherently complicated — most CPI concepts translate naturally into plain language
No specific tools, subscriptions, or accounts are needed; this is conceptual knowledge, not a software tutorial
The time investment is modest. This guide is written to be read in a single sitting, and the concepts build on each other in a logical order. By the end, you'll have a working mental model of CPI that makes every future headline easier to interpret.
Step 1: Start With the Core Definition — What CPI Actually Measures
The Consumer Price Index is a measure of the average change in prices paid by urban consumers for a defined basket of goods and services over time. In plain terms: the U.S. Bureau of Labor Statistics (BLS) tracks the prices of hundreds of everyday items — groceries, rent, gasoline, medical care, clothing — and calculates how much more or less expensive they've become compared to a reference period.
The result is expressed as either a percentage change (e.g., "CPI rose 3.2% year-over-year") or as an index level (where a base period is assigned a value of 100, and current prices are expressed relative to that). The percentage change is what you typically see in news coverage, and it's the most actionable number for everyday readers.
The BLS publishes CPI data monthly. Each release covers the previous month's price data and is one of the most closely watched economic reports in the United States.
Tip: When you see a CPI headline, the most important thing to note is the time frame — is it month-over-month (comparing this month to last month) or year-over-year (comparing this month to the same month last year)? Year-over-year is the more meaningful number for understanding inflation trends.
Step 2: Understand What Goes Into the "Basket"
The CPI basket is the collection of goods and services whose prices the BLS tracks. It is not arbitrary — it's constructed using data from the Consumer Expenditure Survey, which the BLS conducts to understand how American households actually spend their money.
The basket is divided into major categories. Housing (including rent and the equivalent cost of owning a home) typically carries the largest weight. Food, transportation, medical care, apparel, recreation, and education are also significant components. Each category's weight in the index reflects its share of typical consumer spending — so if Americans spend more on housing than on clothing, housing has a proportionally larger impact on the CPI reading.
The weights in the basket are updated periodically to reflect changing consumer behavior. For example, as streaming services became a significant household expense, that shift was reflected in how the basket is composed. This matters because the basket's composition directly determines which price changes move the CPI the most.
A concrete illustration: if gasoline prices spike dramatically but gasoline represents only a small share of the basket, the impact on the overall CPI is limited. If rent — one of the heaviest components — rises steadily, it can push the overall index higher even when other prices are stable.
Tip: When a CPI report comes out, look beyond the headline number. Most BLS reports include a breakdown by category. That breakdown tells you whether inflation is broad-based or concentrated in one area like energy or food.
Step 3: Learn the Difference Between Headline CPI and Core CPI
Headline CPI measures all items in the basket, including food and energy. Core CPI strips out food and energy prices and measures everything else.
Why remove food and energy? Because those categories are especially volatile — they can swing sharply from month to month due to weather events, geopolitical disruptions, or seasonal patterns. A cold winter drives up natural gas prices. A drought affects food costs. These swings are real and meaningful to consumers, but they can obscure the underlying inflation trend that policymakers and economists are most interested in tracking.
Core CPI is considered a better signal of persistent, structural inflation — the kind that reflects fundamental economic pressures rather than temporary commodity shocks. The Federal Reserve and many economists pay particular attention to core CPI (and its close relative, core PCE) when assessing whether inflation is running hot or cooling off.
For everyday readers, both numbers matter — but for different reasons. Headline CPI tells you what's happening to your actual cost of living right now. Core CPI tells you what the long-term inflation trend looks like, and it signals what policymakers are likely to do next.
Tip: When the Federal Reserve speaks about inflation in its policy statements, it typically references core inflation measures. Understanding this distinction helps you interpret Fed communications more accurately, particularly when the Fed's tone doesn't seem to match what you're experiencing at the gas pump or grocery store.
Step 4: See How CPI Moves Markets and Policy
ALT: Chart showing the relationship between Consumer Price Index CPI data and Federal Reserve interest rate decisions affecting financial markets
CPI data is a direct input into some of the most consequential economic decisions in the country. The Federal Reserve uses inflation data — heavily weighted toward CPI and PCE readings — to set the federal funds rate, the benchmark interest rate that influences borrowing costs across the entire economy. When CPI rises above the Fed's target (which the Fed has defined as approximately 2% annual inflation over time), the Fed typically raises interest rates to cool demand and bring prices down. When CPI falls below target, the Fed may cut rates to stimulate economic activity.
This connection has immediate, practical consequences. Rising interest rates mean higher mortgage rates, more expensive auto loans, and higher credit card interest — which is why understanding how the Federal Reserve's rate decisions affect your mortgage and savings is so closely tied to watching CPI releases.
CPI also affects financial markets directly. Bond prices move inversely to interest rate expectations, so a higher-than-expected CPI reading typically pushes bond yields higher and bond prices lower. Stock markets often react to CPI surprises as well — investors reassess earnings expectations based on whether inflation is accelerating or decelerating.
Beyond markets, CPI affects government programs. Social Security benefits are adjusted annually using a measure tied to CPI, a process known as the Cost-of-Living Adjustment (COLA). Federal tax brackets, some student loan programs, and certain wage agreements are also indexed to CPI or related inflation measures. For retirees especially, understanding how Social Security's COLA is calculated starts with understanding CPI.
Tip: On the day a CPI report is released (typically mid-morning Eastern Time on the day of publication), watch how bond yields and stock index futures react in the first 30 minutes. The direction and magnitude of that reaction tells you whether the data surprised markets — and in which direction.
Step 5: Read a CPI Report Without Getting Lost
The BLS publishes CPI reports in a consistent format. Each release includes the headline number, the core number, and a category breakdown. Once you know what to look for, a CPI report takes about five minutes to read meaningfully.
Start with the headline: the month-over-month and year-over-year percentage changes for all items. Then look at the core reading. If headline and core are moving in opposite directions, that's a sign that food or energy is the dominant driver — which is likely temporary. If both are rising together, inflation is broader and more persistent.
Next, scan the category breakdown. Which components rose the most? Which fell? A spike driven entirely by used car prices tells a different story than a rise driven by shelter costs. Shelter inflation, in particular, tends to be sticky — once rents rise, they tend to stay elevated — so elevated shelter readings in the CPI carry more weight than comparable moves in volatile categories.
Finally, compare the current reading to the prior month and to the same month last year. Trend matters more than any single data point. A single elevated CPI reading in isolation is less significant than three consecutive months of rising inflation, and vice versa.
Tip: The BLS posts CPI data on its public website, and the release schedule is published months in advance. You don't need to wait for media coverage — the primary data is freely accessible, and the BLS release itself includes plain-language summaries of the major findings.
Step 6: Understand the Limitations of CPI
CPI is a useful and widely trusted measure, but it is not a perfect reflection of every individual's experience of inflation. Several limitations are worth knowing.
The basket is designed to represent average urban consumer spending. If your personal spending pattern differs significantly from the average — for example, if you spend a much higher share of your income on healthcare, or if you live in a high-rent city — your personal inflation rate may diverge meaningfully from the published CPI.
Substitution bias is another documented limitation. If the price of beef rises sharply, many consumers shift to chicken. The CPI's methodology accounts for some of this substitution behavior, but the degree to which it does — and how quickly updates are reflected — is an ongoing area of discussion among economists.
Quality adjustments are also built into the methodology. If a new laptop costs the same as last year's model but has significantly better performance, the BLS may record that as a price decrease (adjusted for quality improvement). These hedonic adjustments are methodologically sound but can sometimes make the official CPI feel disconnected from what consumers are actually spending.
None of these limitations make CPI unreliable. They simply mean it should be read as a broad indicator of inflation trends, not as a precise measure of any individual household's cost increases.
Step 7: Put CPI Into Context With Other Economic Signals
CPI doesn't exist in isolation. It's most informative when read alongside other economic indicators. Wage growth data (published by the BLS in its monthly employment report) tells you whether incomes are keeping pace with price increases. When wages grow faster than CPI, real purchasing power rises. When CPI outpaces wage growth, workers effectively earn less in real terms even if their nominal paycheck is larger.
Producer Price Index (PPI) data, also published monthly by the BLS, measures price changes at the wholesale level — what businesses pay for inputs before those costs are passed on to consumers. Rising PPI can be an early indicator of future consumer price increases, making it a useful leading signal.
Housing market data and consumer sentiment surveys add additional context. Inflation that is driven by genuine demand — people spending more because they feel economically confident — reads differently from inflation driven by supply disruptions or energy shocks. The accompanying economic conditions shape what CPI data actually means for the outlook.
Tip: Think of CPI as one instrument in a dashboard, not the entire panel. In our work covering financial headlines, a pattern we consistently see is that readers who understand CPI in the context of wages, employment, and Fed policy are far better equipped to interpret economic news — and far less likely to be alarmed by individual data points that are actually consistent with a stable trend.
Common Misreads and How to Correct Them
Symptom — Likely Cause — How to Fix
"CPI went up, so that must be bad news" — Conflating any inflation with harmful inflation; small positive CPI is normal and healthy — Remember that 2% annual inflation is the Fed's target; modest CPI increases are expected and managed
"Core CPI ignores the things I actually buy" — Misunderstanding core CPI's purpose — Core CPI is a signal for policymakers, not a substitute for headline CPI; both serve different purposes
"My costs rose way more than CPI says" — Personal spending differs from the average basket — CPI reflects average urban consumer spending; individual inflation experiences vary significantly
"A falling CPI means prices went down" — Confusing disinflation with deflation — A falling CPI growth rate (disinflation) means prices are still rising, just more slowly; deflation (negative CPI) is a different and rarer condition
"One bad CPI report means a crisis" — Overweighting a single data point — Trend matters more than any single reading; context from surrounding months is essential
Pro Tips for Reading CPI Like an Informed Observer
Going beyond the basics means developing habits that make each CPI release more readable and more useful.
Watch the "shelter" component closely. Because shelter (rent and owners' equivalent rent) carries the largest weight in the CPI basket, its behavior tends to drive overall trends more than any other category. When shelter inflation is sticky — meaning it stays elevated even as other categories cool — the overall CPI tends to remain elevated as well, even when headline inflation appears to be moderating.
Pay attention to how actual CPI readings compare to what economists and markets expected beforehand. A "hot" CPI report that matches expectations may have less market impact than a report that beats or misses by a meaningful margin. The market reaction on the day of release often reflects the surprise factor as much as the absolute number.
Follow the BLS release calendar. CPI reports are published on a predictable schedule, and markets often position ahead of releases. Knowing when to expect a report — and reading it directly from the BLS rather than waiting for media interpretation — puts you closer to the primary source.
One common misconception worth addressing directly: many people assume that when CPI falls, prices have gone down. That's almost never the case. A declining CPI growth rate means prices are rising more slowly — disinflation — not that prices are actually lower than before. True price decreases (deflation) are rare and, when sustained, are generally associated with economic weakness rather than consumer benefit.
Finally, recognize that CPI is backward-looking. It tells you what happened to prices last month, not what will happen next month. Forward-looking signals — energy futures, shipping costs, wage negotiations — can give you a sense of where CPI might trend, but the published figure itself always describes the past.
Q1: How does CPI directly affect my everyday finances?
CPI influences your finances in more ways than most people realize. Social Security benefits, certain federal tax thresholds, and some wage agreements are explicitly indexed to CPI, meaning they adjust as inflation changes. More broadly, CPI drives Federal Reserve policy decisions, which in turn affect interest rates on mortgages, car loans, and savings accounts. Understanding the CPI trend helps you anticipate whether borrowing will get cheaper or more expensive in the near term.
Q2: Is CPI the same as the inflation rate I hear about on the news?
CPI and "the inflation rate" are often used interchangeably in media coverage, but they are technically distinct. CPI is the index — the measured price level relative to a base period. The inflation rate is the percentage change in CPI over a specified period. When a news anchor says "inflation is running at 3%," they are reporting the year-over-year change in CPI. The distinction is subtle but worth knowing: CPI is the tool; the inflation rate is what that tool measures.
Q3: How often is CPI updated, and where can I find the official data?
The Bureau of Labor Statistics publishes CPI data monthly, typically about two weeks after the month it covers. The release schedule is posted publicly on the BLS website well in advance. The BLS press releases include a summary table, category breakdowns, and year-over-year comparisons — all available at no cost. No subscription or special access is required to read primary CPI data directly from the government's official source.
Wrapping Up
The Consumer Price Index is one of the most consequential numbers in the U.S. economy — and one of the most misread. Three core takeaways stand out from this guide.
First, CPI measures the average change in prices across a defined basket of goods and services, published monthly by the Bureau of Labor Statistics. It is a constructed measure with a specific methodology, not a simple observation of reality.
Second, the distinction between headline CPI and core CPI matters. Headline reflects your lived experience of prices; core is the signal policymakers use to set interest rate policy. Both are useful, but for different purposes.
Third, CPI never exists in a vacuum. Its meaning depends on context — what wages are doing, what the Fed is signaling, whether the inflation is broad or concentrated, and whether the trend is accelerating or cooling.
The practical next step is to read the next CPI report when it's released — not just the headline, but the category breakdown. Notice which components drove the number. Compare it to the prior month. Over time, that habit builds the kind of financial literacy that makes complex economic headlines genuinely informative rather than anxiety-inducing.
Stay current on the economic data that shapes markets, policy, and your personal finances — without having to decode jargon on your own. Visit Vega Brief for plain-English breakdowns of CPI releases, Federal Reserve decisions, and every other financial headline that actually matters.
Sources & Citations
U.S. Bureau of Labor Statistics. "Consumer Price Index."
https://www.bls.gov
U.S. Federal Reserve. "Monetary Policy and Inflation Targeting."
https://www.federalreserve.gov
U.S. Bureau of Labor Statistics. "Consumer Expenditure Survey."
https://www.bls.gov
U.S. Social Security Administration. "Cost-of-Living Adjustment (COLA) Information."
https://www.ssa.gov
Note: Government publications and methodological documentation are updated periodically. Check the relevant official agency websites for the most current CPI methodology, release schedules, and policy guidance.
For educational purposes only. Not investment advice. We do not recommend any stock, fund, broker or trading platform. Headlines are sourced from Google News · Business; every story links to the original publishers.